

Share this Post
There are over 5 million buildings in the US and they consume almost 20% of the energy. Hence, there is a need to control the increase in energy consumption with a goal of moving towards curtailing global warming and creating a sustainable environment. Over the last few years, there has been a trend that is being used for these purposes. 1. The explosion of vast amounts of data and the ability to harness this data to provide meaningful information, namely Big Data and 2. an increased awareness of “smart” building capabilities in which most building processes are automated using real-time monitoring using Internet of things (IoT) capabilities. However both these trends are inter-related. Big data analytics is increasingly employed by buildings to enable them to reduce energy costs, decrease CO2 and other emissions, decrease cost of maintenance of buildings and increase tenant satisfaction and real estate value. All this is made possible with the advent of cloud computing technology.
Simplistically put, the IoT implementation usually consists of multiple sensors, controllers and actuators installed within a building and they feed the data from these devices into a cloud-computing platform. These large data sets need storing and processing power as well as advanced software to analyze the data. Cloud computing provides that ability at a fraction of the cost than a traditional data center offers. It also eliminated the need for in-house and expensive hardware, software and network infrastructure costs. It also reduces or even eliminates the high-cost of recruiting technical professionals to support these infrastructures and operate the in-house IT solutions. The cloud platform serves as the data aggregator, analyzer and provider of time-critical and valuable information to any of the team members who are part of the ecosystem like a facility manager, a building owner, asset manager or building engineer. This operational data can be used to fulfill various goals such as how to reduce energy consumption or how to better satisfy occupant needs.
The biggest advantage of these analytics is that it helps with gaining insightful information not just from one building or location in your buildings but across a whole set of buildings and facilities that you wish to manage. This is contrary to traditional BAS (Building automation systems) that are often closed and proprietary and most often present discreet information that can reside in silos.
Modern building systems that use an IoT solution often have thousands of sensors that are networked with each other. This helps with a centralized management system that is capable of integrating with BMS(Building Management systems).Innovations in IoT has led to connected lights, powered meters, occupancy detectors that are capable of interfacing with a centralized control system on the cloud. This presents a single view of the entire buildings’ operations and control.
Portfolio analytics of smart buildings:
Portfolio analytics refers to the aspect of building analytics that offer a consolidated view of the entire portfolio of facilities and buildings spread across various locations. This consolidated data view is possible by implementing an integrated solution that received data from multiple and diverse sources such as sensors and meters located in various buildings. Portfolio analytics provides the ability to derive inputs from the entire information instead of analyzing information separately. Portfolio analytics is almost a necessity today since more and more buildings need accurate and unified information from all their facilities. This offers high quality models and facilities higher quality decisions with accurate results.
There are many factors that help with a successful portfolio analytics solution. Some of them are:
- An integrated solution to be implemented across all locations from which data needs to be gathered. This means installing thousands of sensors if facilities are spread across thousands of square feet.
- Ability to extract and consolidate information from various devices taking into account their security.
- Ensuring that the data is clean and error-free along with data validation.
- A solid strategy to get meaningful insights from the portfolio.
- Subject matter experts to define the approach to generate data analysis.
- Define control actions to be taken. For example, you can define what are the set-points for some utilities, you can also define when alerts and notifications need to be issued and to whom.
Portfolio analytics is incredibly important because of the high complexity of building data and data-based predictive models are better when there is a high number of participating buildings, which in turn produces higher data sets. At the same time, the data needs to be structured and addressed appropriately. One of the ways that is used for structuring the data is to use groups of similar related information. For example, for an office building, similarly sized buildings and it’s related BMS information can be grouped together. This enables the faster detection of deviation when compared to data from similar buildings. Occupancy patterns, BMS information and fault detection processes are also enhanced when grouped in a similar manner.

The portfolio analytics can be made available both offline and online. With offline analytics, the data is collected and fed into the cloud platform periodically at a pre-determined frequency e.g., daily, weekly, monthly or quarterly. Once the data is consolidated from all participating buildings, data modeling can be performed.
Online data analytics, on the other hand, offers continuous collection of data from participating buildings. This allows the portfolio analytics to provide interesting insights and results on the fly. Hence, real-time portfolio analytics gives better results and helps with better overall control. The cloud platform helps in storing, hardware and software and technical expertise needed to analyze this data.
Advantages of portfolio analytics:
Portfolio analytics can serve various needs and goals of buildings. They can be used for establishing baseline, data validation, Fault detection and diagnostics (FDD), prediction of energy consumption, generation of maintenance schedules, occupant comfort levels, building simulations etc. All these processes would be made possible because they depend on large quantities of data spread across various buildings.
Portfolio analytics support the typical goals of any building – reducing energy consumption, increasing occupants’ satisfaction, reducing maintenance costs and increasing reliability.
Multi-user access:
Another huge benefit of the cloud based portfolio analytics is the ability to provide access to a wide variety of users from sustainability teams, asset managers, building engineers, facility managers and building owners. This is an easy setup of identity and user management in the cloud platform. The users preferences and access to various data sets, dashboards and unified reports can be easily defined in the analytics tool. You can define departments, divisions and teams along with team members who need access to specific information. You can set up alerts and notifications depending on the users’ needs. Some buildings establish a data governance playbook to help with defining data that is meaningful to various audiences like business, operational and technical. It is also used to define a set of guidelines for modifying the data as well as ensuring data’s quality.
For example, dashboards for executives provide policy makers and executives actionable information about their portfolio based on monthly utility bills and expenses(Figure1). Facility managers can use this information from environmental sensors, energy meters, systems actuators and building automation systems, regardless of manufacturers, will be collected under a single, integrated platform. Facility managers can use this information for analyzing diagnosis and commissioning. Occupants can also view their information related to their bills and performance indicators specific to their office space usage (Figure2).
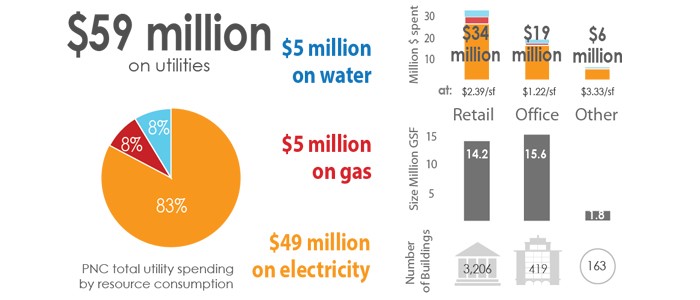
Figure1 : Source : https://www.cmu.edu/cbpdanalytics/
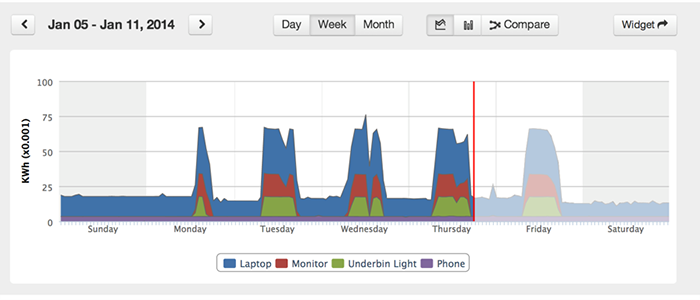
Figure 2:Source: https://www.cmu.edu/cbpdanalytics/
Conclusion:
In conclusion, with recent advancements in building analytics and innovation in Internet of things (IoT), smart buildings are becoming increasingly popular. One of the huge benefits of smart buildings is the building portfolio analytics. Building portfolio analytics collects data from various sensors located across multiple facilities and buildings and presents a unified dashboard of actionable insights on a cloud platform. Portfolio analytics helps achieve various energy goals of a building and offers a huge advantage of predictive modeling because of the volume of data collected. It also offers the added benefits of providing dashboards and reports to different sets of users based on their needs. Modern buildings need to make use of the innovation of portfolio analytics to meet their energy goals.