
Share this Post
Our customers asked, we listened. We are excited to release our new software application capabilities (Apps). We have released two new Apps; a Weather App and a Metering App. The purpose of the Apps is to add additional dimensions to the increasing number and types of data collected in the Senseware platform.
Weather App
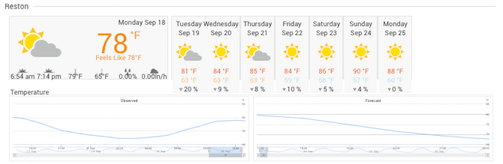
Reports have shown that energy optimization reports lack accuracy due to the complexity of factors driving the energy usage (e.g., weather, power shutdowns, humidity etc.). In addition, as natural disasters and extreme weather become common, it is becoming increasingly important to improve buildings weather preparedness.
The Senseware Weather App features over 48 streams of real-time weather data, including, air temperature, dew point, humidity, daily low and high temperatures, precipitation, pressure, cloud cover, wind gust, wind speed, ozone, and UV index.
Using the Weather App, users can also:
- Show weather data side-by-side with other data types already collected through Senseware to correlate building performance with weather conditions;
- Create a dedicated Weather Dashboard for your building locations; and
- Add weather widgets to their existing Dashboards to see observed weather conditions and forecasts alongside their building systems.
Metering App
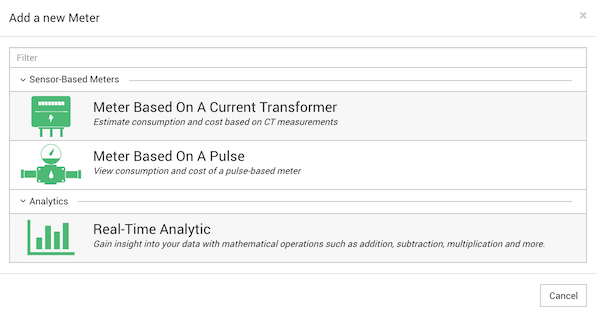
Sustainability measures require analysis of various energy consumption related data. Often times the analysis starts by gathering data on energy usage at various granularity which is then transformed into other useful information such as cost, kWh, and equivalent carbon dioxide emission.
The Senseware Metering App allows users to create new data streams by transforming raw Current Transformer (CT) and Energy, Gas, and Water Meter readings into a variety of useful data. This data is represented by a ‘Meter’ in the system.
The Metering App includes the following options:
Current Transformer Based Meters
Meters based on CT measurements calculate power readings (kW), total energy consumption (kWh), cost ($), and equivalent CO (mtCO). The meter will calculate these quantities based on whether the circuit is single phase, 3 phase, or split phase and how many of those phases are monitored by CTs.
Pulse Based Meters
Pulse Based Meters will use pulse data channel to calculate a variety of consumption and cost calculations depending on the meter type. The meter will calculate these quantities based on the pulse constant, which refers to the amount of energy/water/gas consumed per pulse output.
Real-Time Analytics
This option allows users to transform, in real-time, one or more data channels using a variety of analytic operations into new types of customized and auto-calculated data. The initial available operations include: sum, average, difference, product, and quotient. After selecting the desired operation, you will be able to select the relevant data channels for which you'd like to apply the operation.
The resulting data channels created by the Meters and Real-Time Analytics can be used on the Dashboards for display as Basic Widgets or Chart Widgets, and will allow users to set thresholds and alerts.
Interested in a customized, in-depth demo of these features? Let Us Know.